Citizens have mapped over 2000 cycling incidents on BikeMaps.org. Launched just over a year ago, BikeMaps.org has already created a substantive new source of data on cycling safety, especially in locations like Victoria (>750) and Vancouver (>500) where the research team has focused outreach efforts. Incidents have been mapped in 30 countries including across Canada, the United States, Australia, Germany, and the Netherlands. 21% of data are collisions; 39% of data are near misses; 31% hazards, and 9% thefts.
Some facts from our analysis of the Victoria data.
9.1 % of collisions include multiple bikes and 86% of these resulted in injury.
When the road is dry, 74% of reports are near misses. When it is wet, near misses drop to 51%.
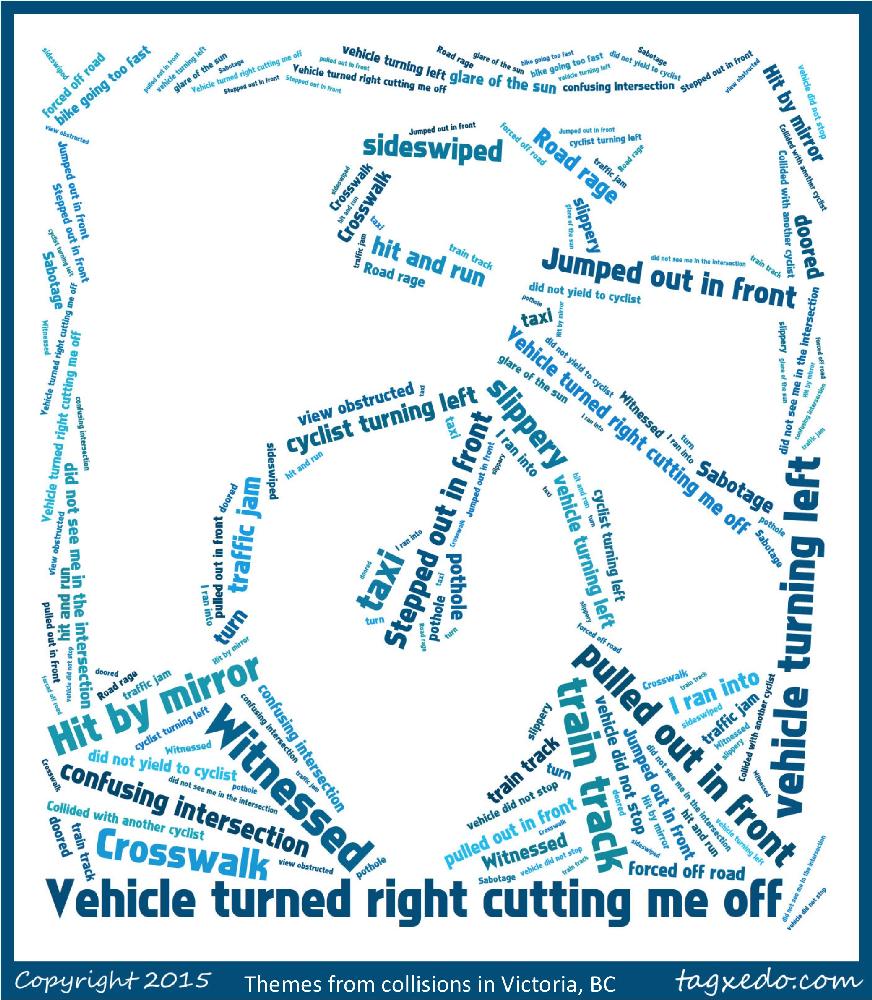
The #1 cause of collisions and near misses: people who are driving vehicles turning right, cutting off the person riding a bike who is continuing straight.
Other common incident causes include: vehicles passing bikes too closely (including cyclists hit by mirrors), vehicles failing to stop, and vehicles turning left.