By Dr. Colin Ferster
One of the most important activities at BikeMaps.org - if not the very most important singular activity - is getting the word out to people who ride bikes. Promotion. The more people use BikeMaps.org, the more useful the map is. This is related to the network effect. The classic example is telephones. The first people who had telephones didn’t have many other people call (but as early adopters, they were probably happy to have it for other reasons). As more people got telephones, they became a very useful tool. This idea has taken on new meaning with many new services being offered on The Internet. At BikeMaps.org, our mission is to collect information about bicycling collisions, near misses, and hazards because only about 30% of bicycling crashes are recorded in official records (see Winters & Branion-Calles, 2017). Once the points start accumulating in an area, the map becomes very interesting for bicyclists, planners, and researchers. We achieve high volumes and densities of data in communities where we have actively promoted BikeMaps.org.
As map specialists, promotion is somewhat new ground for us. The non-departmental examiner on my PhD exam (who came from a business-oriented background) made me look up “network effect” and “social marketing” in an MBA text book and write about it in a revision in my thesis. Looking back, I appreciate the insight! Scientists don’t normally get training in marketing as part of their degrees or academic day jobs. Science communication, and knowledge translation are getting increasing attention, but the goals are different than promoting a mapping project (this is a big part of what we do too). Traditional marketing, as you find it in a text book, also has different goals (we’re not selling anything, we’re trying to find our place in a community, and positive outcomes can take many non-monetary forms (eg. Hou & Lampe, 2015).
Without promotion, some projects might go viral, but many die in the water (Miller, 2006). A common criticism of these projects that didn’t see their potential is that the founders tried to “build it and they will come”. This has become code for not understanding your audience. At the Citizen Science Association conference this year in Minneapolis, Minnesota, there was some surprise, and possibly discomfort, that some of the talks were about promotion. “So marketing is a part of science now?” was one particularly pointed question. At lunch, I heard the sage Caren Cooper remark “of course, you have to understand your audience”.
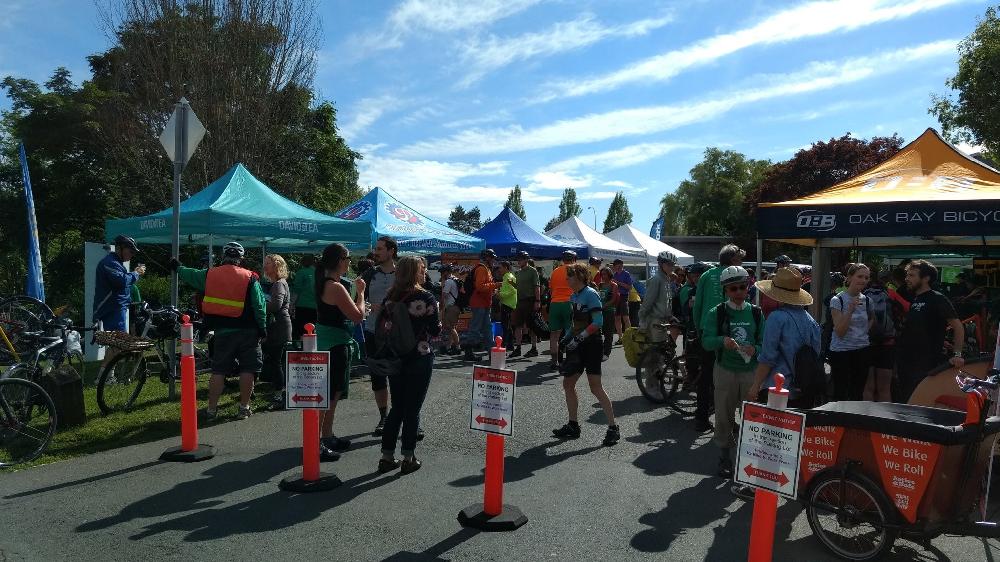
For BikeMaps.org, that has meant hitting the ground, at first locally in Victoria and CRD. We talked to people engaged in the cycling community and started building a presence at cycling events like Bike to Work Week. This is one of our favorite activities because we get to talk to present and future BikeMaps.org contributors. We love being outside and talking to people about bicycling and mapping. Earned media (e.g. press release by university communications team with BikeMaps.org data products) has been invaluable. We also engage in guerilla marketing, for example, by covering parked bikes at bike racks with BikeMaps.org water bottles or saddle rain covers.

With this initial success, we set off to promote in cities across Canada. Given the more challenging cross-country logistics, we wanted to know what was effective, so we can make the most of the resources available to us. As well, a goal of active transportation planners is to make bicycling accessible to “all ages and abilities”, so we wanted to know which promotion activities are effective for engaging a diversity of audiences. We used Google Analytics to understand who is viewing BikeMaps.org and the optional demographic information to understand who submitting data to BikeMaps.org. Our findings were recently published in the open access journal Urban Science.
Promoting Crowdsourcing for Urban Research: Cycling Safety Citizen Science in Four Cities
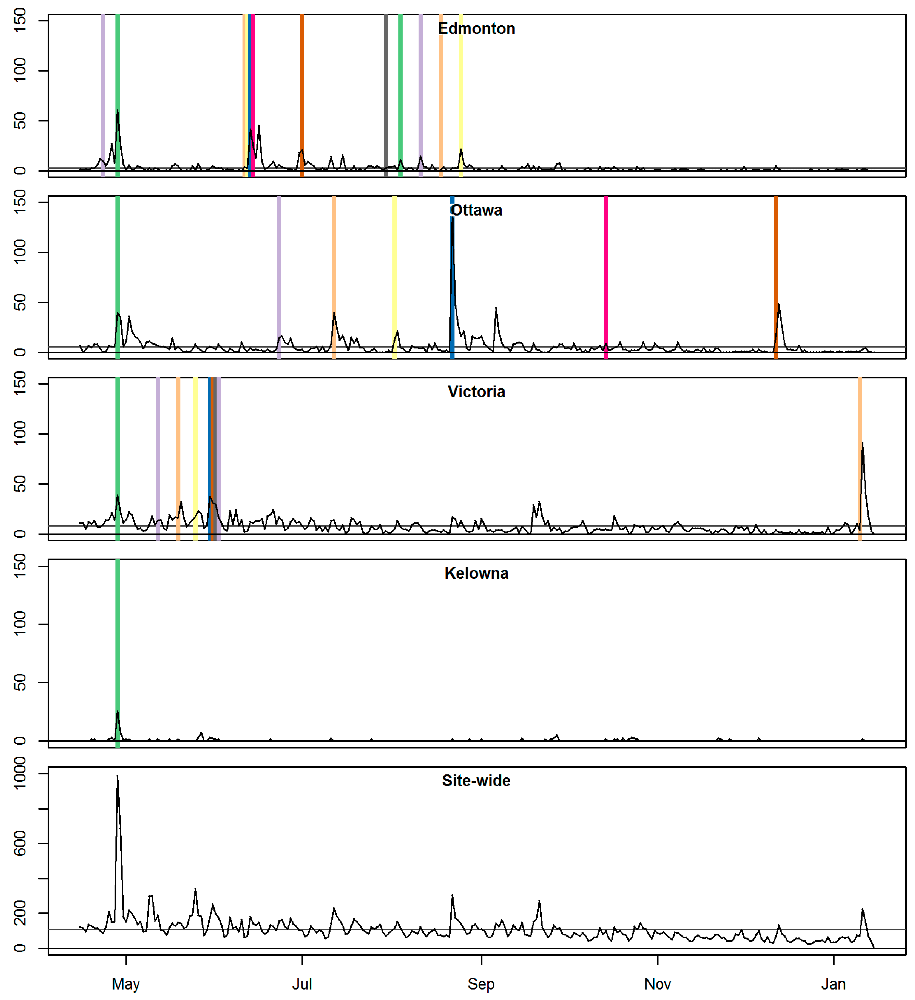
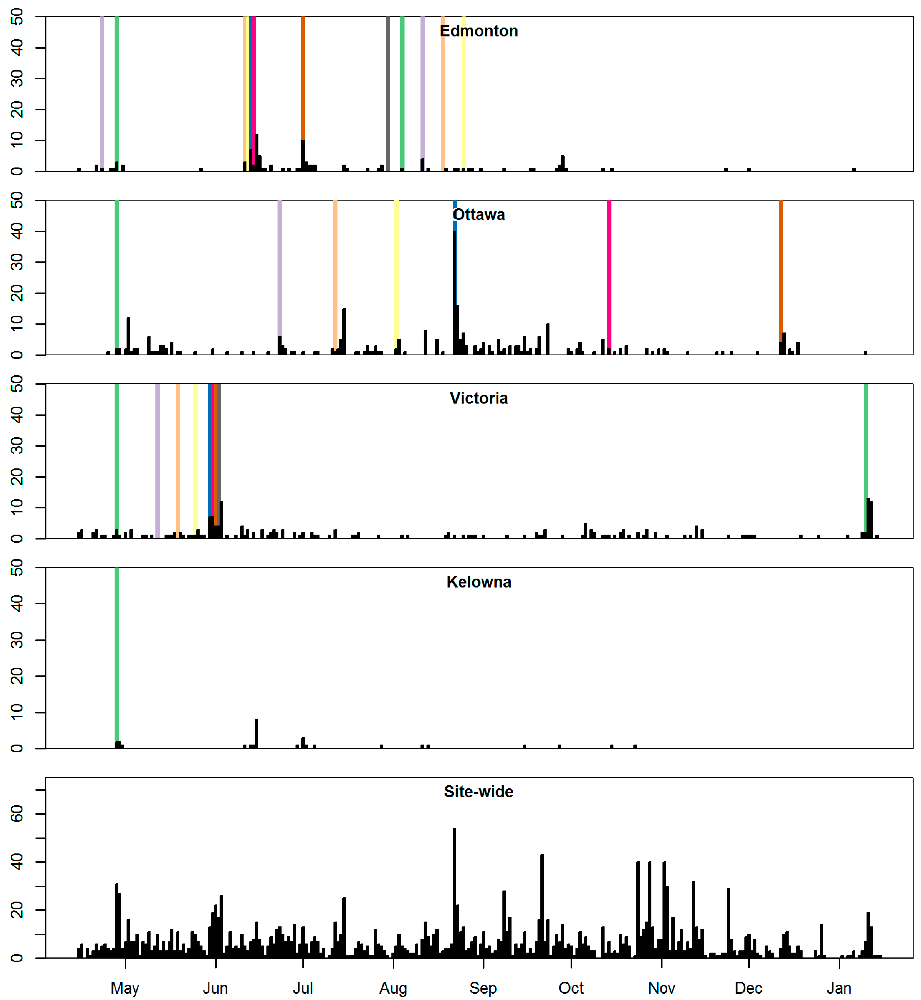
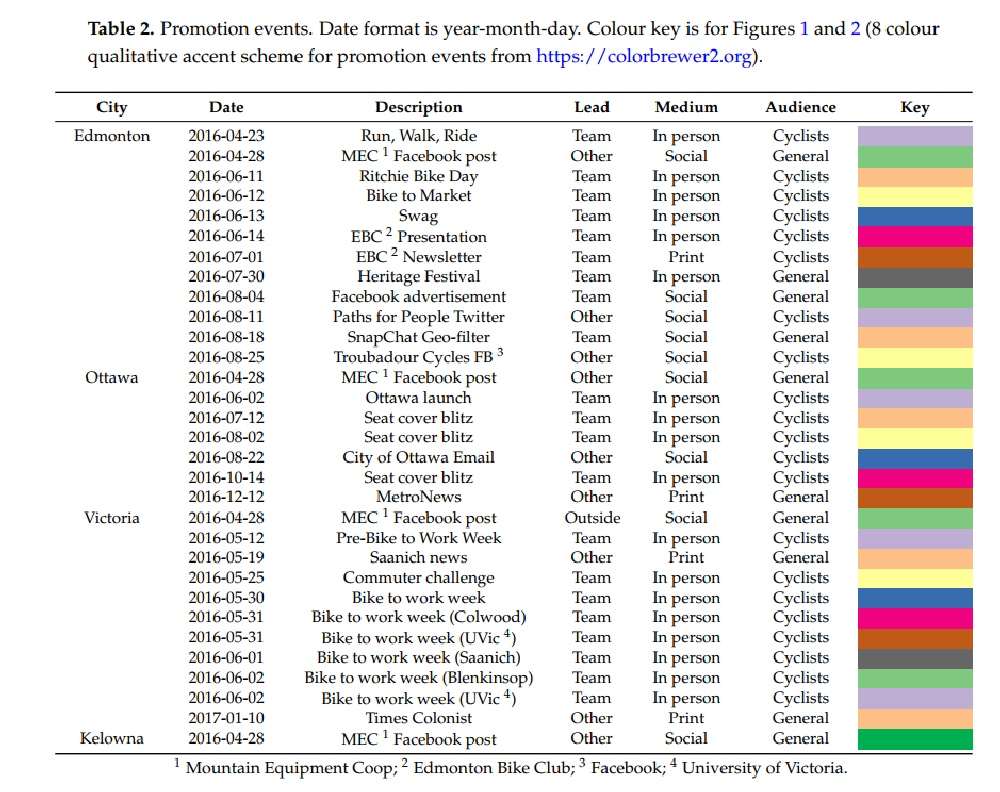
In this paper, we evaluated how outreach and promotion events related to BikeMaps.org use by demographic groups in the Capital Regional District (CRD), Edmonton, Ottawa, and Kelowna. We found that BikeMaps.org use strongly correlates with promotion. After each event we see a spike in web views and incidents reported. This reaffirms that promotion really is critical to the success of BikeMaps.org. Without it there are not enough points to make useful maps. We also found out that we can use different promotion strategies to engage different audiences. Bike-related events (e.g. Bike to Work Week or mention on social media by bike groups) led to the most incidents submitted, while more general events (e.g. newspaper coverage or mention on social media by outdoor retailers) led to fewer incidents mapped, but more diversity. In cities with few points mapped (Ottawa, Edmonton, and Kelowna), people started filling the map with hazards. In cities with many points already mapped (e.g. CRD), more people used the website to look at the map (without reporting anything) or report collisions and near misses. Cities that had higher bicycling mode share and positive relationships between city planners and bicycling groups (e.g. Ottawa and CRD) were more receptive to using BikeMaps.org. Spontaneous high-use events (without promotion) occurred in communities where BikeMaps.org use was already established. We concluded that our promotion efforts should aim to engage both current bicyclists and more general audiences.
 Figure 1. Web views (lines) and promotion events (vertical lines; not to scale)
 Figure 2. Incidents reported (barplots) and promotion events (vertical lines; not to scale)
We hope that these published findings can be helpful for other crowdsourcing and citizen science projects in cities. With any luck, you’ll see us at the next cycling event in your city!
Thanks for biking, and thanks for mapping!
References Hou, Y., & Lampe, C. (2015). Social Media Effectiveness for Public Engagement. Proceedings of the 33rd Annual ACM Conference on Human Factors in Computing Systems - CHI ’15, 3107–3116. http://doi.org/10.1145/2702123.2702557
Miller, C. C. (2006). A Beast in the Field: The Google Maps Mashup as GIS/2. Cartographica, 41(3), 187–199. http://doi.org/10.3138/J0L0-5301-2262-N779
Winters, M., & Branion-Calles, M. (2017a). Cycling Safety: Quantifying the underreporting of cycling incidents. Journal of Transport & Health, 1–6. http://doi.org//10.1016/j.jth.2017.02.010
