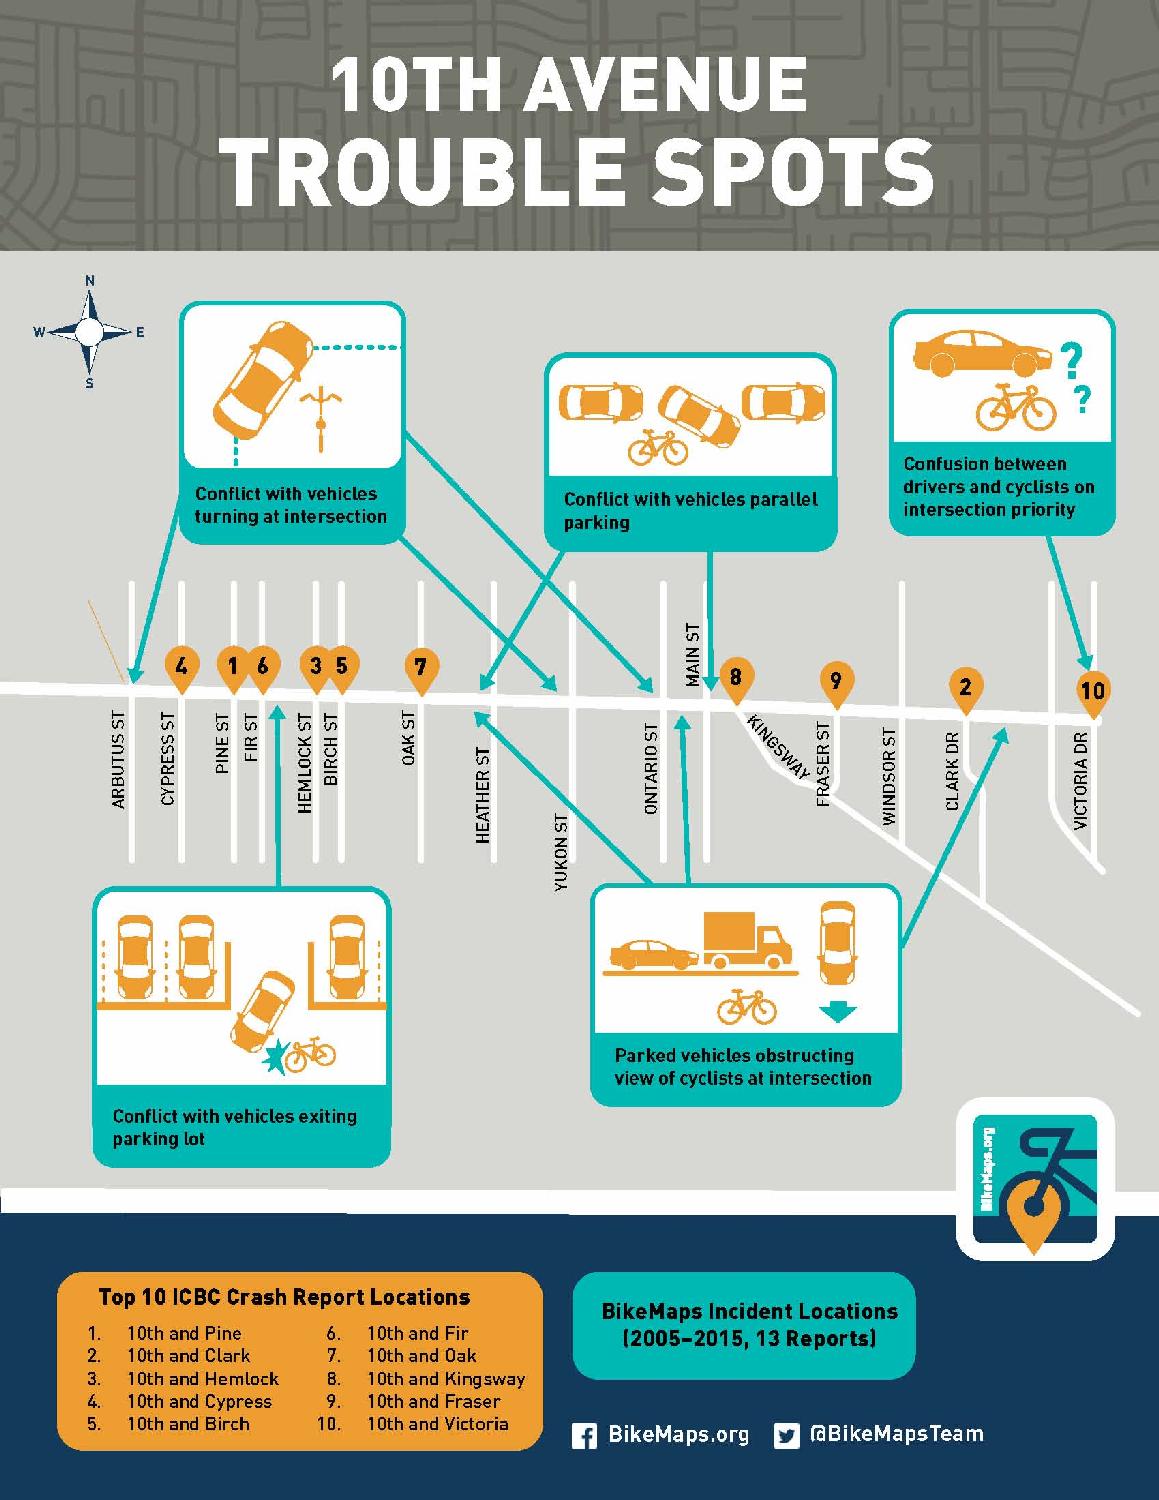
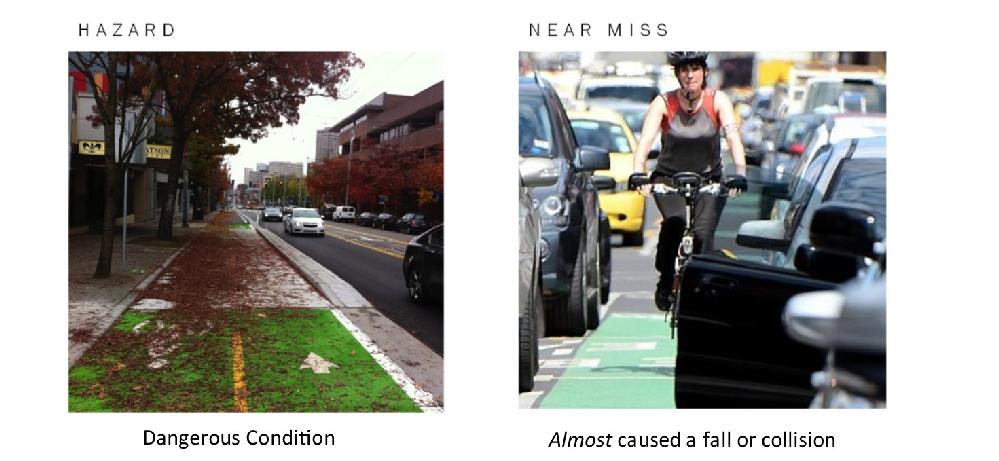
BikeMaps.org
  • Home
  • Visualization
  • Blog
  • About
  • Language
    • English
    • Español
    • Français
    • Íslenska
    • Suomeksi
    • Dansk
  • Guest
    • Log in
    • Register

BikeMaps Blog

  • Jan 4

    BikeMaps.org Promotion in MetroVan

    Jan 4
    Tweet

    This fall marked the expansion of BikeMaps.org to Metro Vancouver, a region home to almost 2.5 million people. As BikeMaps.org was relatively new to the region, our first step toward improving cycling safety was getting more cycling incidents reported on the website. To do this, we needed to raise awareness of BikeMaps amongst regional cyclists. With funding from the Bullitt Foundation, we focused on two main promotional events: a bike saddle cover drive and information tables at Bike to Work Week (BTWW) celebration stations. These events helped to increase the average daily reporting frequency by nearly 300 per cent (from 0.8 reports/day to 2.3 reports/day). As of December 2015, citizens reported over 520 cycling related incidents in Metro Vancouver, propelling us to 75% of our reporting target. The success of these initiatives helped us complete a cycling safety analysis of Vancouver’s 10th Ave. corridor. As more cyclists learn about BikeMaps.org and incident reporting continues to grow, BikeMaps.org is well positioned to make a valuable contribution to cycling safety in the region. MetroVan logo

    On October 23, a five-person team of BikeMaps volunteers, together with a Bullitt cargo bicycle loaded with over 600 brightly coloured BikeMaps.org saddle covers, travelled a 5.7 km route in Downtown Vancouver outfitting the saddles of parked bicycles with covers. Cyclists were encouraged to take a photo of their new saddle cover and uploaded the photo to Instagram for a chance to win a prize.

    Saddle collage

    The MetroVan BikeMaps team attended 10 Bike to Work Week (BTWW) celebration stations during the week of October 26-30, 2015. Stations were scheduled in the morning (07-09:00) and afternoon (16-18:00) peak periods in municipalities across the region. To encourage cyclists to visit our table, we included a prize draw for BikeMaps.org T-Shirts (daily), and one 100$ gift card. We engaged directly with 250-300 individuals over the course of BTWW, which enabled us to introduce BikeMaps.org, answer questions, and give demonstrations on how to report incidents.

    BTWW collage

  • Dec 21

    2000 Pins on BikeMaps.org

    Dec 21
    Tweet

    Citizens have mapped over 2000 cycling incidents on BikeMaps.org. Launched just over a year ago, BikeMaps.org has already created a substantive new source of data on cycling safety, especially in locations like Victoria (>750) and Vancouver (>500) where the research team has focused outreach efforts. Incidents have been mapped in 30 countries including across Canada, the United States, Australia, Germany, and the Netherlands. 21% of data are collisions; 39% of data are near misses; 31% hazards, and 9% thefts.

    Some facts from our analysis of the Victoria data.

    • 9.1 % of collisions include multiple bikes and 86% of these resulted in injury.

    • When the road is dry, 74% of reports are near misses. When it is wet, near misses drop to 51%.

    • The #1 cause of collisions and near misses: people who are driving vehicles turning right, cutting off the person riding a bike who is continuing straight.

    • Other common incident causes include: vehicles passing bikes too closely (including cyclists hit by mirrors), vehicles failing to stop, and vehicles turning left.

      cookies yyj collision word cloud

  • Nov 27

    10th Avenue Corridor - Vancouver, BC - Cycling Safety Trouble Spots

    Nov 27
    Tweet

    A new report from the Pembina Institute found that cycling in Vancouver is quite safe when compared to other Canadian cities. It highlighted that while we have separated cycling facilities in the downtown core, a majority of the bike routes are “actually just signed routes on residential streets that are shared with cars”.

    Yet any cyclist in Vancouver knows that some of these local street bikeways feel safer than others. One of the busiest local street bikeways is 10th Avenue, with over 500,000 cyclists each year. In the summer over 2,500 cyclists a day pass Clark along 10th Avenue. But 10th Avenue has a high number of cycling collisions relative to other corridors in the city, based on the City of Vancouver’s 2015 Cycling Safety Report.

    Mapping cycling safety data can identify where improvements are most needed. Our BikeMaps.org team looked at 128 ICBC-reported cyclist collisions (2009-2013) to identify the top trouble spots along the corridor and also BikeMaps.org data to understand the types of incidents that are happening. Conflicts with cars certainly stand out along the corridor – both moving cars and parked cars.

    acart 10th ave map

    Luckily, the City of Vancouver has 10th Avenue as a priority route for upgrades to be more safe, convenient, comfortable and fun for people of all ages and abilities. Some changes have already happened, such as green paint to mark the intersection at 10th and Clark. If you want to know more about the City’s plans, their public consultation materials are here. You can also give the City feedback by writing to 10thAvenue@vancouver.ca. We will watch for their design plans in early 2016 and look forward to safer cycling!

    About BikeMaps.org: This global online mapping tool was launched in Fall 2014 with the goal of capturing more data on cycling safety. It was developed by Dr. Trisalyn Nelson and the Spatial Pattern Analysis and Research (SPAR) Lab in UVic’s Geography Department. The BikeMaps.org Team includes Dr. Meghan Winters, a population health researcher from SFU. The MetroVan BikeMaps.org Team has received funding from the Bullitt Foundation to promote mapping across the Lower Mainland. With more locations pinned across Metro Vancouver, researchers will be able to document areas with cycling safety issues in the region. These results can be used by advocates and municipalities to identify priorities for infrastructure investments, resulting in streets safer for cycling.

    Logging an incident is anonymous and only takes a minute or two. You can also receive alerts of any incidents on your route by creating an account. Both android and iOS mobile apps are available for citizen mappers to use BikeMaps on their mobile devices.

    We welcome all feedback and interest in the project. Get in touch by email info@bikemaps.org, on Twitter, or through Facebook. Share a cycling photo on Instagram by tagging @BikeMapsMetroVan.

  • Oct 1

    Galloping Goose/Lochside Trail - Cycling Safety Trouble Spots

    Oct 1
    Tweet

    pic

    We are studying cycling safety along the Galloping Goose and Lochside Regional Trails. Data submitted to BikeMaps.org has highlighted trouble spots for people riding regional trails in and around Victoria. Ben Jestico (Geography MSc Student leading the study) has been working with volunteers to survey these and other regional trail road crossings. Students are collecting intersection design characteristics, as well as cycling and vehicle volumes. We will analyze data to provide recommendations for the safest designs.

    Ben, who was surveying at Harriet Road this week, said, "That intersection count gave me high blood pressure! There were lots of cars turning off and onto the highway that just didn't see people cycling." Ten incidents have been reported to BikeMaps.org where the Galloping Goose crosses Harriet Road.

    If you have had an incident while cycling on a regional trail, please add your data to BikeMaps.org and include your experience in our study!

    The regional trail project is funded by Bunt and Associates and NSERC.

  • Sep 23

    BikeMaps.org's 1st Birthday

    Sep 23
    Tweet

    Birthday Invitation

« Newer posts Older posts »