BikeMaps.org
  • Home
  • Visualization
  • Blog
  • About
  • Language
    • English
    • Español
    • Français
    • Íslenska
  • Guest
    • Log in
    • Register

BikeMaps Blog

  • Dec 5

    12 Days of Bike Mapping

    Dec 5
    Tweet

    By Colin Ferster

    This holiday season, we invite you to join us for the 12 days of Bike Mapping. We are highlighting 12 themes for infrastructure editing on OpenStreetMap (OSM). OSM is an open source map of the world. Bike infrastructure data from OSM shows up all over the web, including the BikeMaps.org basemap (we use the CyclOSM basemap, which is a rendering of OSM data that give visual priority to safe and comfortable infrastructure).

    Each day in mid-December (from Dec 12 to 23), we will identify a bike infrastructure data priority and provide support for contributing to OSM. We will post blogs and tweets with resources, and we will be available to help out. We identified these themes based on our experience developing a national bike infrastructure dataset based on OSM data.

    As a quick easy way to give feedback, we have an ArcGIS online app (also embeded below) where you can comment on the previous version of Can-BICS, and where applicable, we will edit the data directly on OSM. We need your eyes on the ground. Simply add points or draw lines with descriptive comments on the map below.

    For those with experience using OSM, we will also provide resources, discussion, and highlight themes where editing will be especially valuable.

    All of our OSM contributions conform with the OSM bicycle wiki and Bike Ottawa tagging guidelines, to the best of our ability.

    Cheers, and talk to you soon!

  • Mar 2

    Mapathon Wrap-Up

    Mar 2
    Tweet

    by Colin Ferster

    We ran a mapathon in January as part of developing OSM Can-BICS, a national bicycling infrastructure datasat. The motivation for this mapathon was to provide an opportunity to collect community feedback on the map, and for our team to contribute some labour to OpenStreetMap (OSM), the datasource for our national dataset. This blog is a summary of the results and reflections.

    Tools and approach

    We promoted the mapathon on Twitter. We also had previously collected feedback (and recorded errors) from face validation sessions in seven Canadian municipalities with planners and technicians working for cities.

    We built an ArcGIS Online app where people can draw lines where our national dataset doesn’t reflect what’s on the ground. There was also the ability to add points with free form text to explain any issues. We are lucky to have access and training for ArcGIS online from the SFU Library. The app was quick and easy to deploy.

    Then we reviewed the contributed data and edited OSM following guidelines on the OSM wiki and de facto national standards from Bike Ottawa.

    Results and reflections

    The mapathon was a reminder of the vastness of national datasets! Every time I look at OpenStreetMap data, I appreciate the skill and dedication of OSM contributors. Our edits were mostly in western Canada where our team is located, and mostly in Vancouver and central Vancouver Island. Future efforts will be more strategic in identifying locations that need work.


    Map of edits 
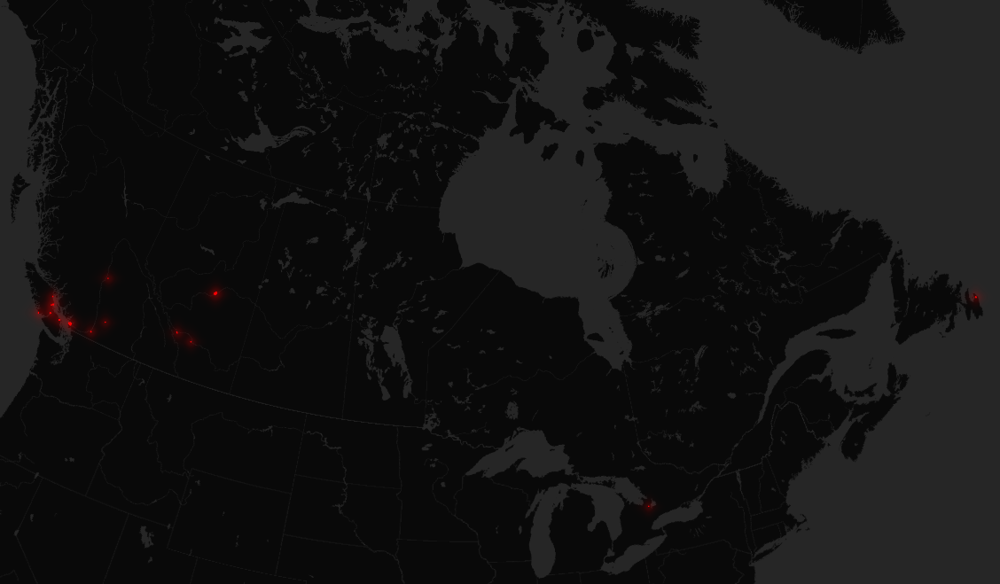
Figure 1. Map of edits (in red) contributed using the ArcGIS app, which we subsequently contributed to OSM following Bike Ottawa tagging guidelines. Basemap from CartoDB, data by OpenStreetMap contributors (2022).

    Edmonton stepped up big time! We shared a map of downtown that had some obvious issues. It was a lot easier to untangle with local help. The detail of the contributed edits was impressive, and we feel a lot better knowing that the representation of downtown Edmonton is closer to reality.


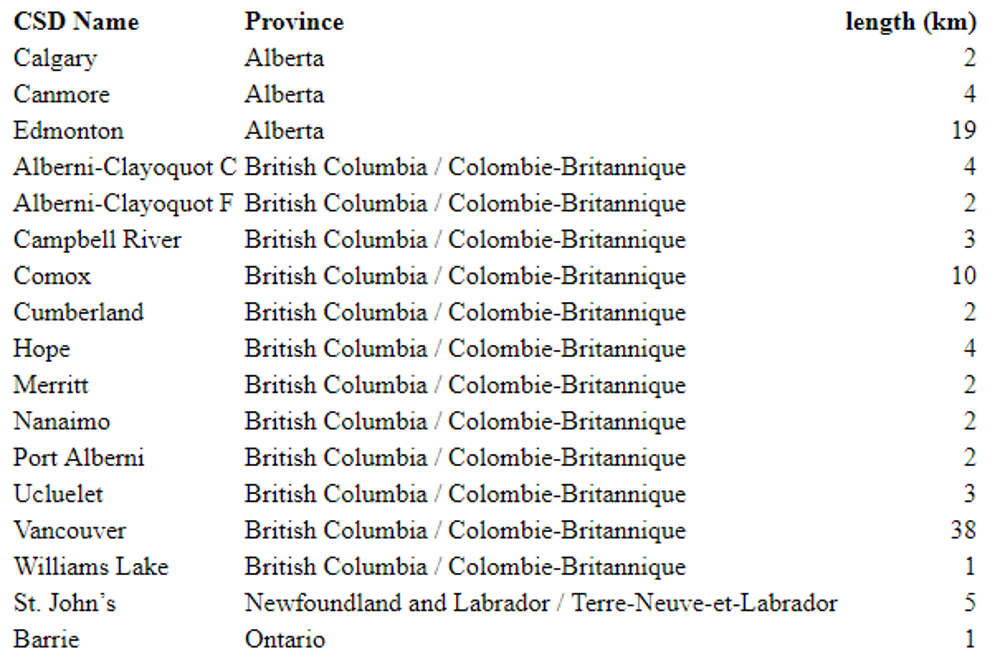
    Table 1. Summary of edits by Canada Census Subdivision (CSD). Note that this underestimates the total distance edited, since it doesn't count the point comment edits, and incidental fixes (fixing intersecting paths and roads).

    One of the issues we saw constantly arise is a lack of surface tags (e.g. paved or unpaved) on multi-use trails on OSM. We think this is an important tag for planning trips! Both for cyclists (what bike/tires do you need to ride there?) and for more general accessibility (gravel doesn’t work for everyone).


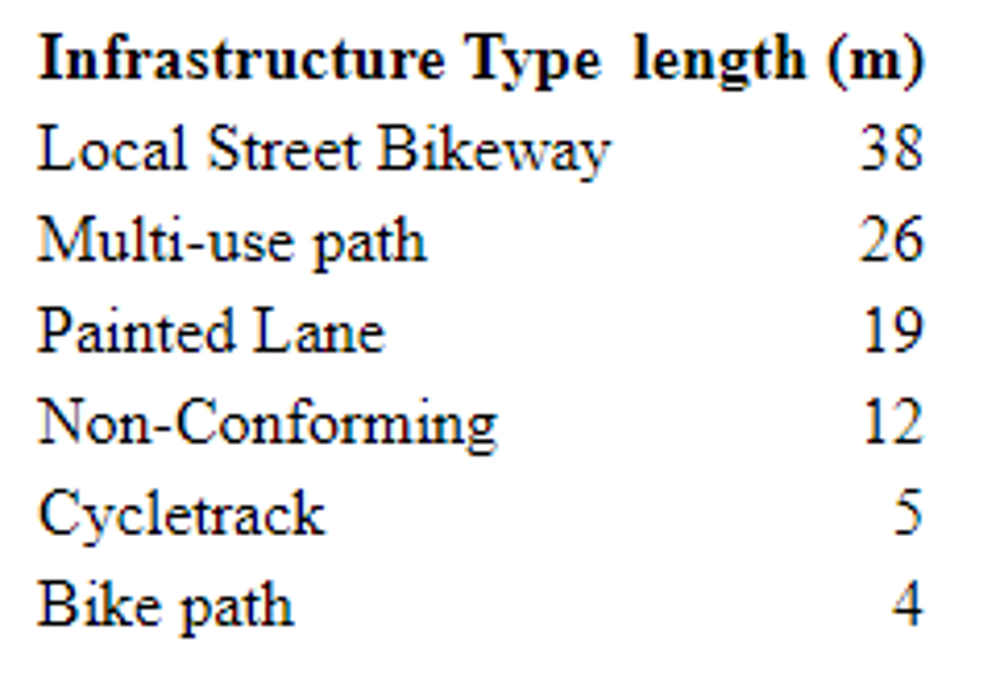
    Table 2. Summary of edits by infrastructure type.

    Additionally, OSM lacks resolution on roads with two lanes or fewer. There’s a big difference between local street bikeways with traffic calming and traffic diversion (common in Vancouver) and two lane roads with 50 km/hr limits. We know that few people pay attention to speed limits, but reduced speed limits combined with traffic calming and traffic diversion makes a meaningful difference. Note that local street bikeways are missing from the Bike Ottawa coding guidelines. My spring and summer mission will be adding traffic calming, surface tags for trails and paths, and pedestrian separation for bike paths.

    During the mapathon, we learned about TriCityFix (maps here). This is a great example of what can be done with OSM, because OSM data span across multiple city boundaries. The TriCityFix app supports advocacy work. It also shows how consistent tagging practices (for example, following Bike Ottawa Guidelines in Canada) benefits multiple projects (Bike Ottawa, TriCityFix and Can-BICS all benefit from consistent tagging).

  • Jan 5

    January Canadian Bike Infrastructure Mapathon

    Jan 5
    Tweet

    by Colin Ferster

    We’re working on a national bike infrastructure dataset and we need your help to make sure we have it right. Building a national infrastructure map is a massive challenge. We’re using OpenStreetMap (OSM) because it is available across the country. OSM is the volunteered map of the world. We completed a study comparing OSM with official data, and found reasonable agreement. It’s a bit like a Wikipedia of mapping - it’s super useful, but it’s not perfect, and we can make it better.

    Editing OSM will improve a wide range of apps that use OSM basemaps. Our data (derived from OSM data) is available for free to support a wide range of studies to help with:

    1. Promoting bicycling.
    2. Understanding who has access and who doesn’t have access to these facilities
    3. Understanding the safety and health outcomes of access to bike infrastructure.


    You know your places best.
    Official data is often missing important details. We have all experienced bike infrastructure that exists on the map, but is lacking on the ground (the famous disappearing/unsafe bike lanes). We need help identifying missing and incorrectly attributed infrastructure. How do the places that you know, where you live, where you work, and where you visit look on the map? We invite you to mark up the map below. We will use the information to update OpenStreetMap, and we will launch a revised version of the OSM Can-BICS national bike infrastructure dataset in mid February.

    Figure 1. Preliminary classification of OSM data using Can-BICS labels. Our classification uses OSM tags, as well as geographic context such as landcover and traffic diversion to assign Can-BICS labels with an average accuracy of 76 ± 3% for presence or absence of infrastructure (by length within 15 sample cities). The map and data are available on ArcGIS online. The app is available here. Click on the smart editor widget in the upper left to mark missing or incorrect features.

    We have three methods that you can contribute, and we are happy to provide assistance.

    • Editing OSM directly. Include the tag “#CanBIKE” in your comments.
    • A google form.
    • Marking up the map (this might be the most fun).


    Marking up the map.

    Zoom into an area in Figure 1, above (or directly in the app.). Use the smart editor tool (located near the top left corner of the map), and map what you know is currently on the ground.
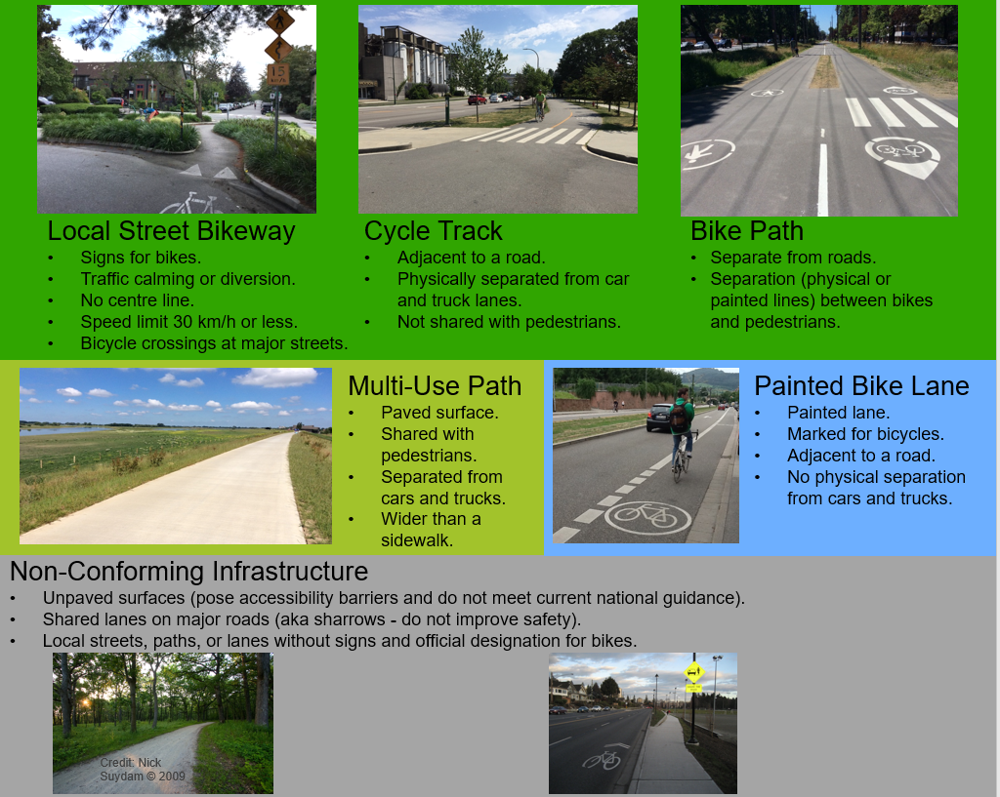
    • If the map is missing features, draw them in.
    • If the map is incorrect, draw over the existing lines on the map.
    • Please provide a description and any helpful notes.
    • Use the point comment feature to make more general comments about places.
    • We will enter the data on OSM and revise our dataset.
    • Don't worry too much about precise spatial positioning in this step. We will align the data with existing OSM data using aerial imagery.
    • Contact canbikemapathon@gmail.com with any issues.


    Coding key: Simplified Can-BICS coding key. Figure 2. The Canadian Bikeway Comfort and Safety Classification System offers a consistent classification for Canada that prioritizes all-ages-and-abilities infrastructure. The labels were determined based on a review and synthesis of open data in 45 municipalities, engineering design guides, and expert review. Detailed coding instructions are available here..

    Example

    We added a multi-use path. 
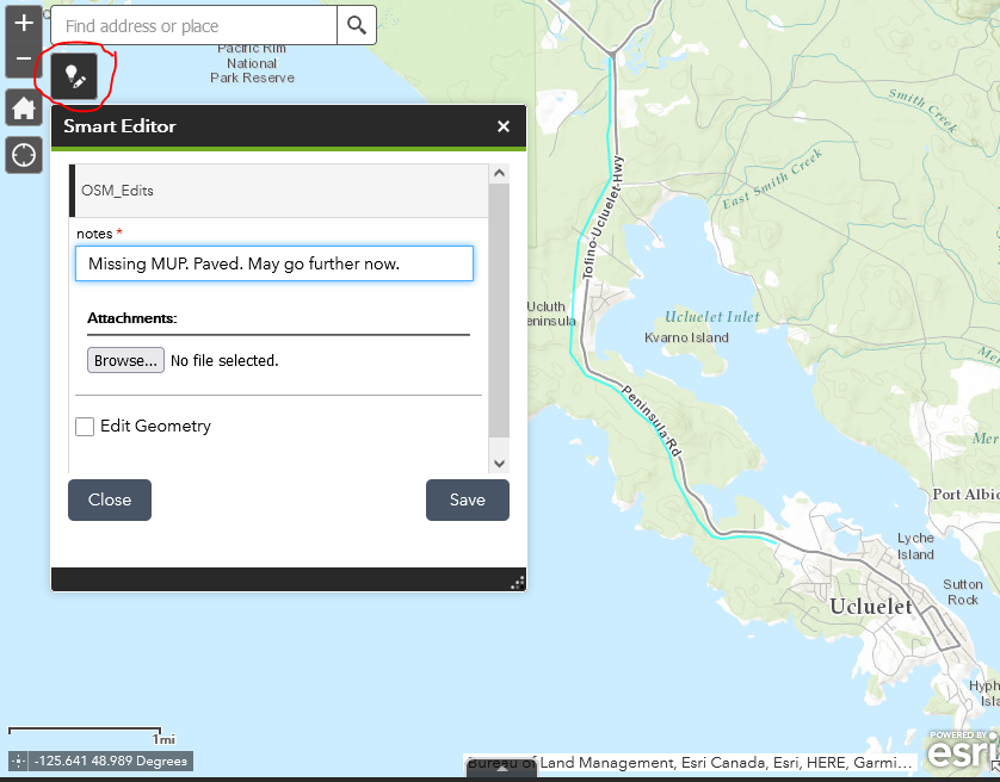
Figure 3. Here we digitized a missing multi-use path. We know that it starts at Forbes road, runs on the left side of the highway, and meets the Alberni Highway junction. We think it might go further now, but it has been a long while since we visited. Anyone know how far it goes? This is why we need your help!

    Thank you for mapping!

  • Oct 18

    WalkRollMap.org

    Oct 18
    Tweet

    Happy Walktober! Going for a walk might be an easy way to get physical activity, yet not everyone has access to safe and comfortable places to walk. Sidewalks might be crumbling, narrow, or nonexistent. The safe way across a busy street might result in a frustrating 500m detour. Or perhaps you’ve experienced a scary near miss with a vehicle or have recently tripped and fallen. All these experiences factor into our decision to walk and may be barriers to walking, especially for people who have limited mobility.

    A new crowdsourced website is hoping to change that. WalkRollMap.org has recently been developed by researchers at the University of Victoria, Simon Fraser University, and Memorial University with funding from the Public Health Agency of Canada. Crowdsourcing offers a way to fill in the data gaps left by traditional sources such as police reports or insurance claims. Building upon their experience with BikeMaps.org, the team led by Dr. Trisalyn Nelson has created WalkRollMap.org to gather reports of barriers to safe, comfortable walking or rolling on sidewalks and pathways. Website users can map three different types of reports: 1) Hazards or Concerns; 2) Missing Amenity; or 3) an Incident (collision, fall, or near miss). It’s easy! Just drop a location pin and respond to a short series of questions.

    Participation is anonymous, but demographic details such as year of birth, gender, and ethnicity are collected to better understand who the project has reached. Data collected by WalkRollMap.org will be shared with municipalities and advocacy groups to help improve the pedestrian environment. Have something to report from your walk? Simply go to WalkRollMap.org through your browser on any device. (Any issues experienced while bicycling should continue to be reported on BikeMaps.org.)

    For More information, please contact WalkRollMap.org Project Manager, Karen Laberee: klaberee@uvic.ca near miss walk

  • Jul 9

    Improving bicycling data on OpenStreetMap

    Jul 9
    Tweet

    by Colin Ferster

    OpenStreetMap (OSM) is the volunteered map of the world. Contributions are wide and diverse, from hobbyists to commercial interests. OSM spans across boundaries and allows many uses. That makes it a compelling dataset for personal, research, and commercial use!

    CyclOSM Basemap on OSM

    As part of the Canadian Bikeway Comfort and Safety Classification System (Can-BICS) project, we are using OSM to map bike facilities across Canada.

    Can-BICS is a system of classification for bike facilities that aligns engineering guides, open data provided by cities, and current bicycling safety and preference research into a common classification framework. We are developing queries and GIS operations to classify OSM across Canada according to Can-BICS labels.

    As part of developing this classification, we collected more than 2000 ground reference points to train the classification and evaluate accuracy. We are also becoming active editors of OSM cycling data (in the spirit of leaving the campsite nicer than we found it). In the process of viewing the data, we are amazed by the extent and detail of mapping (if you contributed, thank you!!).

    We put together some tips for people who want to edit bike data. For experienced editors, we have four recommendations for improving OSM bicycling data in Canada from the perspective of active transportation researchers.

    Getting started

    For those starting out, the best place is learnOSM. It introduces OSM, navigation, and basic editing and is well worth the time.

    For mapping bicycling features, the OSM wiki has two key reference pages, and many more specific pages to explore:

    • https://wiki.openstreetmap.org/wiki/Bicycle
    • https://wiki.openstreetmap.org/wiki/Key:cycleway

    Bike Ottawa has an excellent guide for consistently tagging bicycling features. OSM Can-BICS aligns with this coding scheme, and I use this reference in my own editing. The only limitation is for local street bikeways (which may be uncommon in Ottawa). See the recommendations section below for more about local street bikeways.

    • https://github.com/BikeOttawa/OSM-Bike-Ottawa-Tagging-Guide

    My experience

    For contributing to bicycling data for safety research, I find myself adding tags to paths and bikeways on roads. I use OSMAnd for navigation on my smartphone (or just look at OSM in a webrowser when I'm planning a trip), and if it doesn’t match what I see on the ground, I will try to make it better! My favourite approach is to pick up a free tourist map and mark it up with a pencil while I’m riding my bike or visiting a place. There are tidier approaches, like field papers . I also refer to aerial and street level imagery from Bing Streetside or Mapillary(both have sharing agreements with OSM). Finally, I often spend some time rectifying pdf or paper maps from municipalities against OSM to find missing features.

    Recommendations for improving the quality of cycling data for active transportation research

    • Add surface tags to paths and trails. Surface is important for accessibility (Kay Teschke said “so many people need smooth surfaces beyond cyclists”). Yet 20% of our sample of multi-use trails was missing surface tags. Unpaved trails are great (they provide connectivity, recreation, and more), but providing surface tags on OSM will help the people who need accessible facilities find them and the information will help active transportation researchers too.


    • Map separation between pedestrians and bikes using segregated=yes or separate geometry depending on the situation. Bike paths that are separated from pedestrians are a recent development in many places in Canada that are helpful where there are high volumes. They are associated with lower collision severity compared to multi-use paths.


    • Map traffic calming on local street bikeways. One of the greatest challenges we faced in developing OSM Can-BICS is distinguishing local street bikeways (which have traffic calming and diversion), from shared lanes on major roads ( which have higher risks and severity of collisions)! Even a two lane residential road with a 50 km/h speed limit (first example below) is a much different experience than a greenway with traffic calming that forces traffic to slow down (second example below). We are having trouble on residential roads that are borderline. It’s helpful to map the features that make these good for riding: reduced speed limits, traffic calming features, and traffic diversion.


    • Map both the good and the bad. One of my favourite things about OSM is that the mapping reflects the bicycling experience: great bike paths are seldom missing, while questionable shared lanes or sketchy painted lanes are sometimes missing. For bicycling safety research, it’s helpful to know where the terrible shared lanes on major roads are too. The danger is that this might attract people to ride there by giving it more visibility on the map. Make sure that the other road attributes are included for warning (e.g. # of lanes, speed limits, on-street parking etc.).


    Anything to add? We would love to hear from you.

« Newer posts Older posts »