by Ed Wiebe
The first thing you should know about black ice is that it’s not black.
In fact, black ice is almost completely transparent. It contains no air bubbles or cracks and that makes it look black because we see right through it to the dark road surface that lies beneath. What makes it so treacherous is that surfaces covered in black ice often look wet not icy. If you learn to look out for the common ways it can form you can avoid having your bicycle slip out from under you.
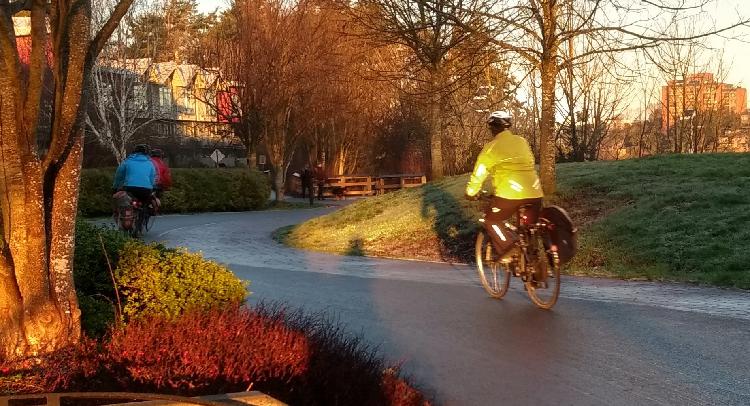 Fig. 1. An icy trail early in the morning in Victoria, BC.
The classic black ice scenario is an early morning ride, under clear skies, with an air temperature just above freezing. The paved trail or street looks bare but as you turn a corner you find you’re on thin ice. Your wheels slip sideways and before you know it you’re on the ground nursing a bruised ego or worse.
I live in Victoria, BC, Canada. The winter climate here is warmer than most of Canada, but we see many days when the temperature is close to or below freezing for part of the day. This back and forth cycle of temperature across the freezing point is a key part of the recipe for black ice formation.
Watch out for the following:
The cold seasons: from when frost starts to form in the fall until the chance of frost diminishes again in spring.
Clear nighttime or early morning skies — but be wary on a morning when clouds are forming just before sunrise.
Available water. This may be liquid water or high relative humidity.
A smooth road or trail surface in a relatively open area, with a good view of the sky.
A place where the trail or road dips, or a bridge that passes over a shallow valley.
Four ingredients
Black ice needs four basic ingredients. You’ll always find them together, though the path to a slippery surface may vary.
In more wintry places than Victoria, you’ll be safer. When the air and ground temperature stay below freezing, there won’t be any liquid water around to freeze into black ice. Watch out for days when snow on or beside roads or paths melts briefly and then refreezes. Also, surfaces treated with road salt can refreeze as they cool further.
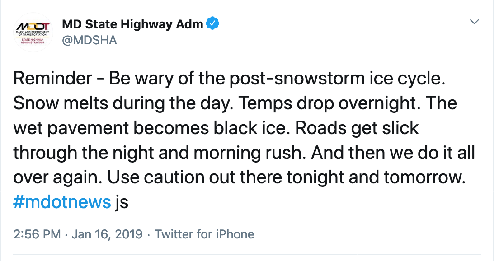 Fig. 2. https://twitter.com/MDSHA/status/1085672137002835968
Smooth Surface
For black ice to form, a thin layer of water has to be able to cover the small bumps and irregularities in a surface. Asphalt rolled flat on roads and paths is ideal. It’s non-porous and smooth. Concrete can be smooth enough, but surfaces like sidewalks are typically roughened to reduce the risk of slipping.
Water
The water that forms black ice can fall from the sky as rain, or be directly deposited as dew or frost. It may also flow across road or paths when nearby ice and snow melts.
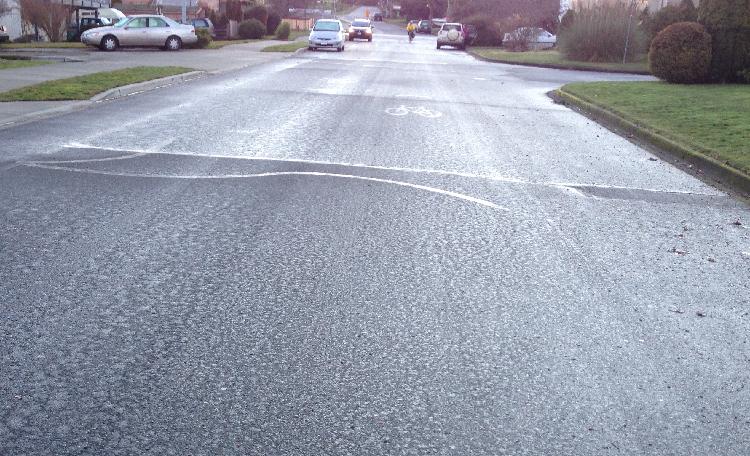 Fig. 3. Ice on San Juan Ave in Saanich, BC.
Freezing Temperature
For ice to form on a surface the water that’s present has to be cooled to 0 °C or lower. Strangely, this can happen when the air temperature is warmer than freezing, as long as the surface itself gets cold enough. Often, we’ll encounter black ice on days when the air temperature a few degrees above freezing.
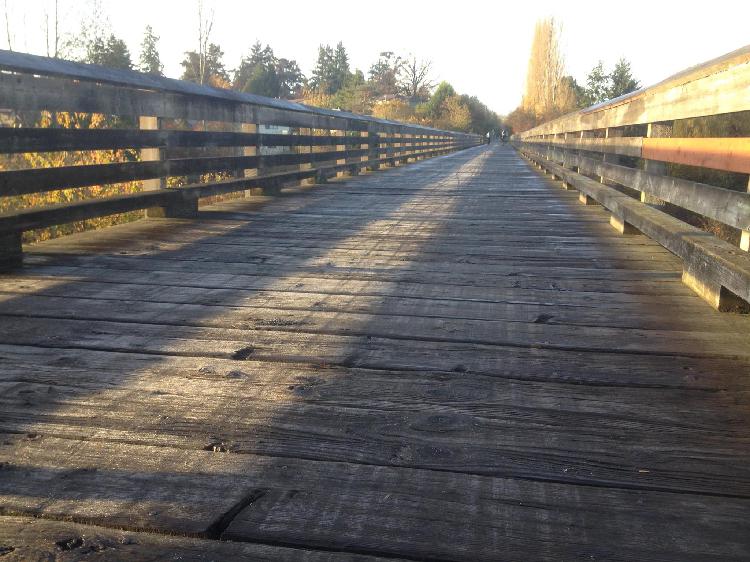 Fig. 4. The long wooden trestle over Swan Creek in Saanich, BC, spans a shallow valley and a stream. Cold air pooling in the valley, a source of moisture, and radiative cooling lead to an icy surface.
How does it work?
Let’s go back to the classic scenario mentioned in the introduction. How does the surface chill to freezing if the air temperature is above 0 °C?
Radiative cooling.
The surface of the earth, like every other object in the universe, radiates energy away in the form of infrared light. At night, with no sunlight to warm it, the surface of the earth radiates energy away and cools. If there are clouds in the sky, they slow down the cooling by radiating energy downwards, but on clear nights, the temperature of the earth’s surface can drop sharply.
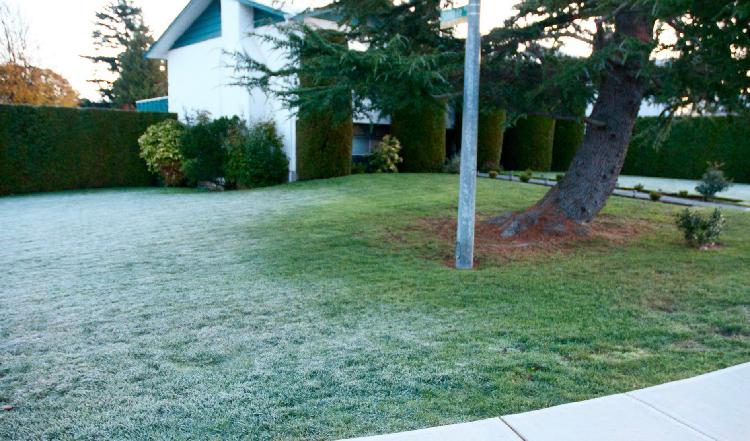 Fig. 5. Frost forms on surfaces where there is a clear view to the sky. The tree is a source of infrared energy and keeps nearby surfaces a bit warmer.
With a cold surface below it, air that lies near the cold ground at night also cools. When air is cooled its relative humidity increases. This can lead to dew formation and shallow layers of fog (shown below). Cold air is more dense than warmer air so the cold air tends to flow slowly to shallow depressions where it may pool. These layers of air might be only a metre or two thick. They will continue to chill throughout a clear night.
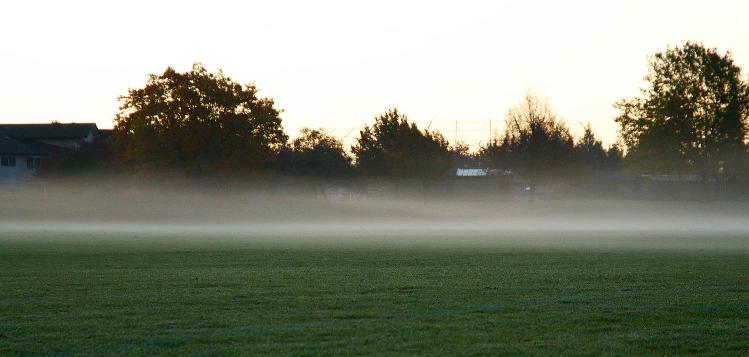 Fig. 6. Radiation fog can form in still air that chills due to radiative cooling. The lawn is a source of moisture.
Wind
If it’s windy the very cold layer at ground level won’t form. The wind will stir up the the layer of air closest to the ground and make it deeper. Wind also encourages evaporation, drying surfaces simply by moving more air past available water.
Dew and Frost
Barring wind, we’ll get a relatively cold surface under clear skies. When a surface cools to the dew point temperature of the air just above it water vapour mixed in with the air will begin to condense. This is dew. If the chilled surface reaches the freezing point the dew will freeze. Since surfaces tend to continue to cool under clear skies overnight a dewy road can become an icy hazard by sunrise.
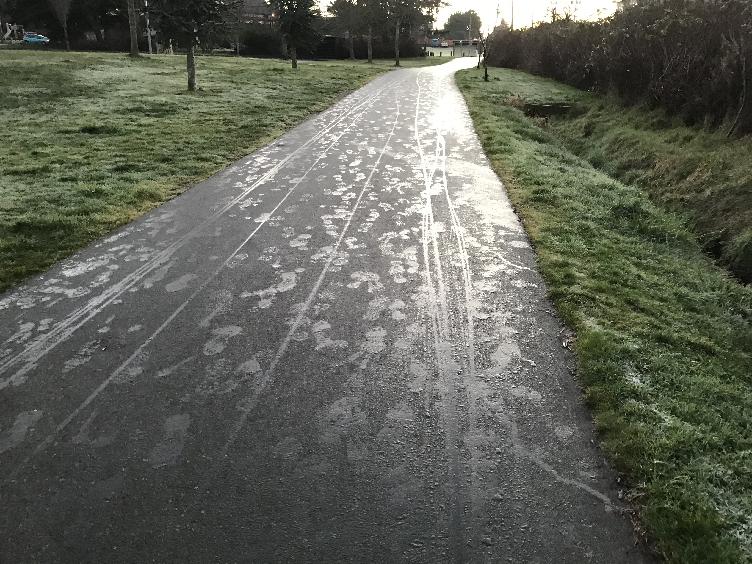 Fig. 7. Heavy dew on a climb in Saanich, BC, Canada.
When the dew point temperature is below freezing we no longer see dew forming. Instead, water vapour crystallizes directly onto surfaces and grows into tiny separate crystals forming a white crust. This is frost. It’s more visible and rougher so frost is less dangerous to pedestrians and cyclists. Frost is also unlikely to grow on smooth ice that’s already formed.
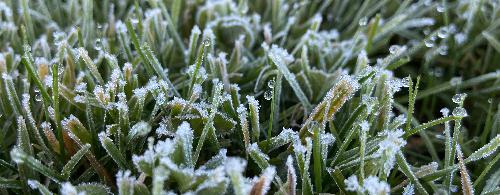 Fig. 8. Frost and some dew drops on grass.
Examples
Galloping Goose Trail southwest of the Selkirk Trestle
This paved trail lies parallel to the Gorge waterway in Victoria, BC (Fig. 1). The water is relatively warm and lies a few metres below the level of trail. The (relative!) warmth of the waterway makes it a prodigious source of water vapour. On a clear night parts of the trail are well exposed to the sky.
Lambrick Park and Nearby San Juan Avenue
Lambrick Park lies in a shallow valley, a broad open area of lawns and playing fields. The colder air that pools there on a still night can be several degrees colder than nearby higher ground. Often, if there’s no breeze, a thin layer of radiation fog forms in the park. There’s a lot of available moisture due to all that lawn. The ground below the fog is probably not below freezing because even fog is a source of energy (everything radiates infrared light), albeit a weak one. Timing is important, though. The surface below may have cooled to below freezing before the fog arrived.
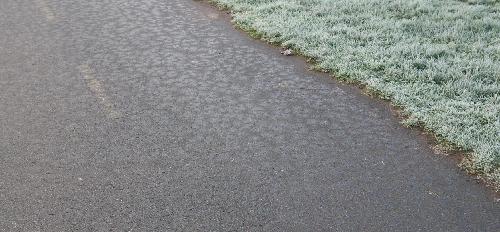 Fig. 9. Ice on the trail and frost on grass in Lambrick Park, Saanich, BC.
Some of the streets north of Lambrick Park (Fig. 3) run perpendicularly to the sides of the shallow Shelbourne Valley. Cold, moist air flows downslope in these areas and black ice can form in depressions. Be wary.
Wooden Trestle Bridges
Trestle bridges can be terribly icy (Fig. 4) even though they aren’t particularly smooth. In this case the water, accumulating from rain, melting snow, or condensation, gathers in the porous, ridged surfaces of the planks. Suspended above the ground the entire structure can cool to the air temperature which may be considerably below freezing. Worse still, the bridges are there to help cyclists cross waterways that run below. There is plenty of moisture around.
Summary
Important The key black ice warning sign to remember is clear skies overnight. Clouds in the sky, though cold themselves, add a source of energy for the surface. This means that surfaces under clouds at night tend not to cool below the air temperature.
Wind is also important. Even if only a light breeze, wind can keep relatively warm air moving past the surface. Wind also causes mixing. A thin cold layer can’t form. What cold air that may have otherwise flowed gently downslope toward shallow valleys is not able to pool and get still colder.
 Fig. 10. A thermometer that shows when ice is possible.
Extras
Other ways for black ice to form
Light rain on a cold enough road surface.
Very cold air temperatures and car exhaust — lots of moisture in exhaust
Fresh snow, compressed by human activity, that freezes solid when the temperature drops further.
Humidity and Relative Humidity
People often think that clouds are made of water vapour, but this is incorrect. Water vapour is an invisible gas; clouds are made from tiny water droplets or ice crystals that reflect light and so appear white or grey. Humidity is a measure of the water vapour, an invisible gas, that is mixed into the atmosphere. When we say the humidity is high or low we’re referring to how much water vapour is present.
Relative humidity, as you may see reported by a meteorological agency, is a way to talk about the amount of water vapour in air. There is a limit to how much water vapour the atmosphere can hold. That limit depends on the air temperature. Warm air can hold much more water vapour than cold air (there’s an exponential relationship). What’s really important for understanding dew formation or clouds and rain is the relative humidity.
If we measure how much water vapour is present and compare that, as a ratio, with the amount that could be present given the temperature of the air we get the relative humidity. If it’s raining the relative humidity will be close to 100%–that’s why it’s raining! At low relative humidities, below about 25%, we become uncomfortable because our exposed skin and the delicate membranes in our noses and throats dry too quickly.
High humidities are also uncomfortable, even dangerous, especially when it’s warm. This is because we use evaporation to cool ourselves and that’s less efficient when the relative humidity is high.
Dew point Temperature
The dew point temperature is the temperature that a sample of air would have to be cooled to for condensation of water vapour to begin. This doesn’t mean that the all of the air nearby must be chilled. Importantly, any surface in contact with the air that chills to the local dew point temperature will receive condensation.
If the dew point temperature is below freezing it’s called the frost point temperature.
The dew point is always less than the air temperature.
Ed is a Scientific Assistant in the School of Earth and Ocean Sciences at UVic who teaches and works in Climate Modelling and Meteorology. He builds and manages Victoriaweather.ca, a high resolution meteorological network on Vancouver Island.
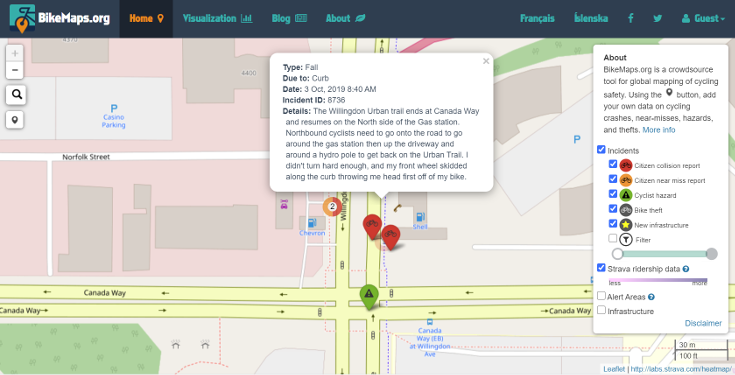 Two cyclists reported falls near the intersection of Willingdon Avenue and Canada Way, in Burnaby, BC, Canada.
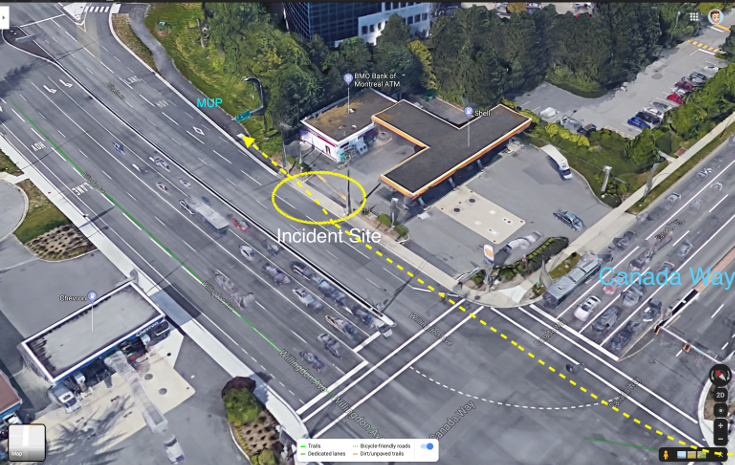 Many cyclists use the bus lane to bypass the 50 m gap in the Willingdon multi-use path.
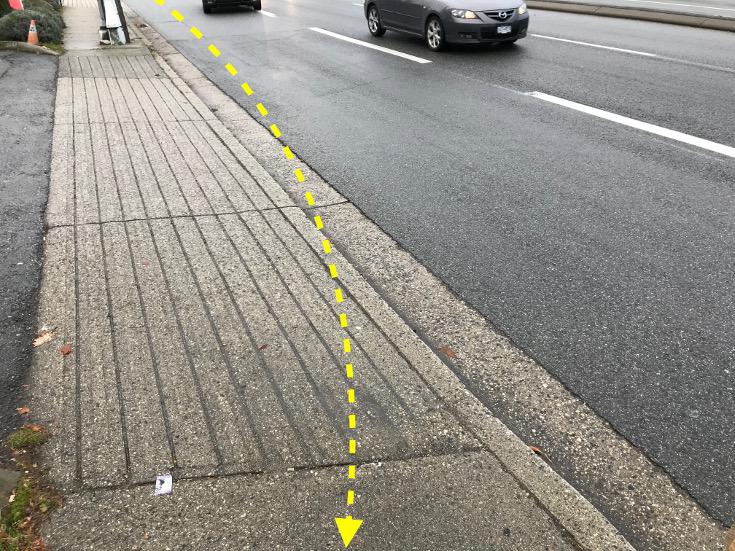 At least two people have fallen and were injured trying to get back onto the path at this driveway.
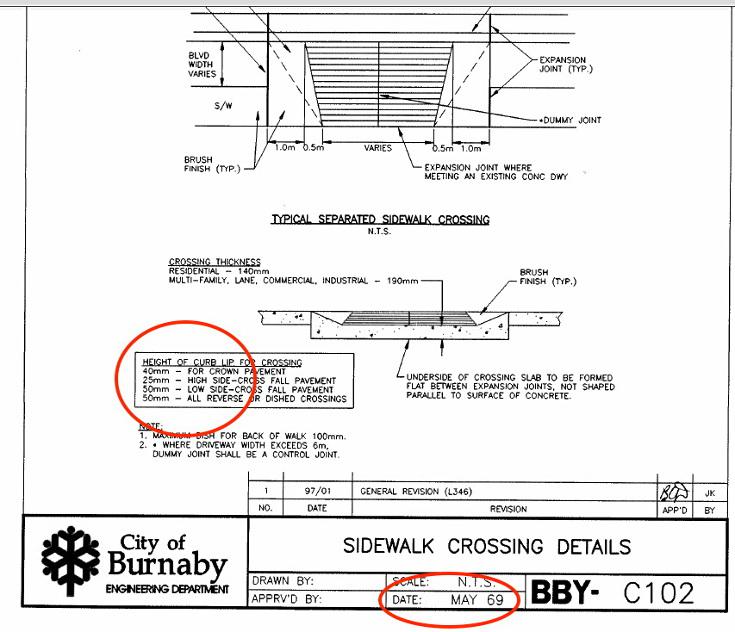 The 1969 design standard for driveways includes a curb lip raised between 4 - 5 cm above the roadway surface, presenting a solo-bicycle fall hazard to cyclists.
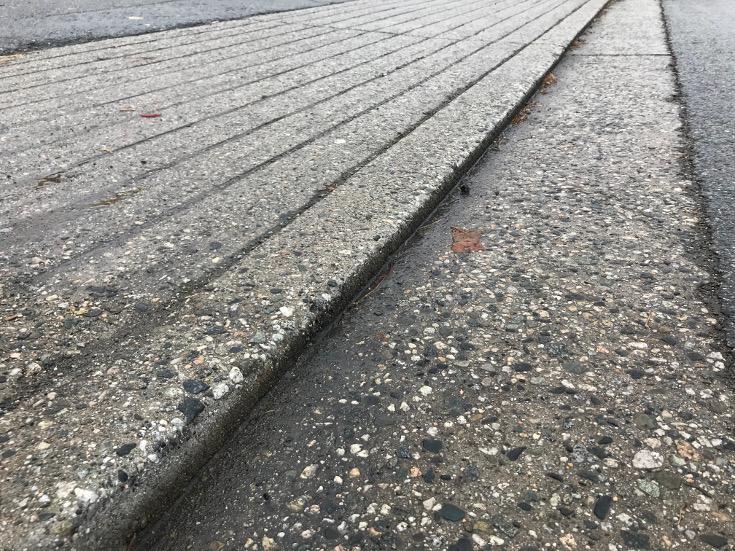
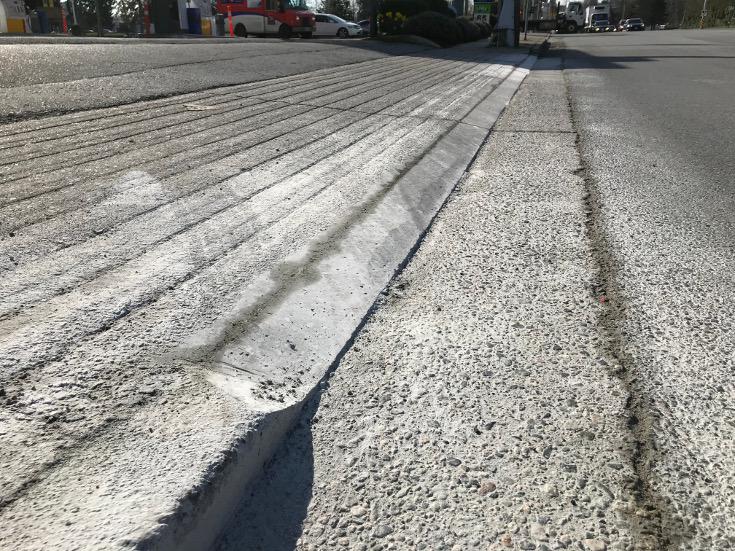 The driveway apron lip was ground to be flush with the curb gutter pan, eliminating the fall hazard.